
Your company-wide close rate may be hiding the real sales problem.
Imagine two sales representatives:
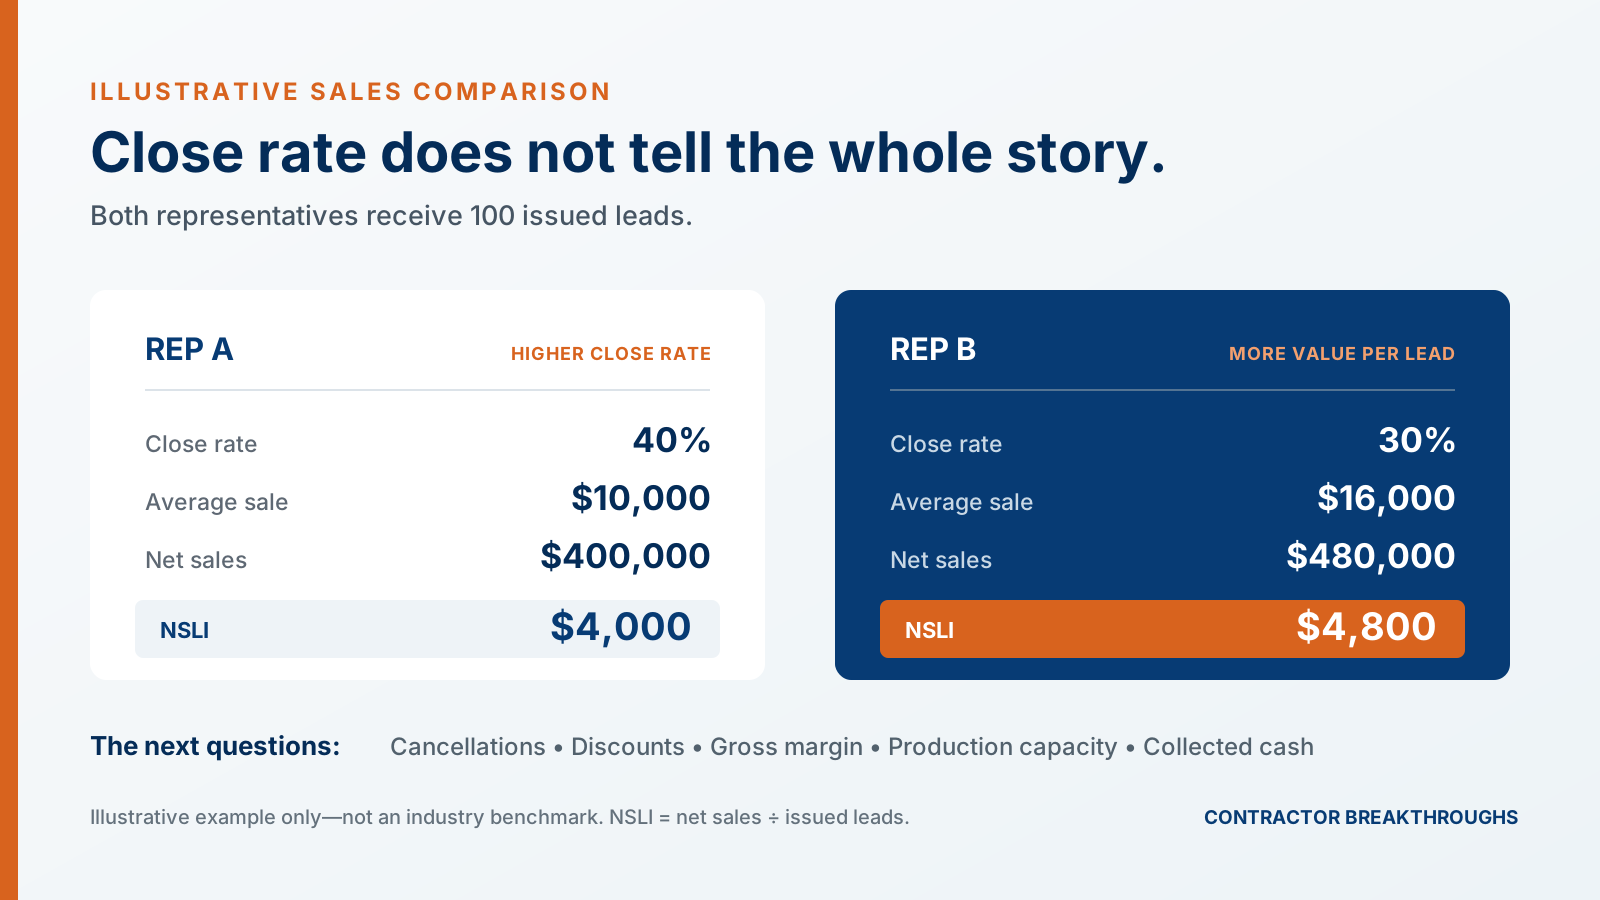
- Rep A closes 40% of issued leads at an average sale of $10,000.
- Rep B closes 30% of issued leads at an average sale of $16,000.
If you only look at close rate, Rep A appears stronger.
But from 100 issued leads, Rep A generates $400,000 in sales—or $4,000 in net sales per lead issued—while Rep B generates $480,000—or $4,800 per issued lead.
That is why we prefer to look at net sales per lead issued (NSLI) alongside close rate, average sale, cancellations, discounts and gross margin.
No single number tells the whole story. An owner should also ask:
- Are both reps receiving the same types of opportunities?
- Does one rep sell more work that later cancels?
- Are high sales being produced through excessive discounting?
- Do the jobs sold by each rep produce comparable gross margins?
- Are leads being assigned based on geography and product knowledge, influenced by which reps are friendliest with—or complain most to—the person assigning them, or simply sent to whichever rep is next?
Lead assignment is not just a scheduling decision. It’s a revenue-allocation decision.
If your next lead goes to the wrong sales rep, sits untouched for two hours or gets scheduled when the right crew is already booked out, the loss may later appear as a marketing problem.
It isn’t enough to say, “We generated 100 leads and closed 35%.”
You need to know which leads became profitable jobs, who handled them, what they sold for, whether they stayed sold, what they cost to produce and when the cash was collected.
The objective is not to create a complicated dashboard.
It’s to give the owner enough visibility to answer a practical question: Where are we creating value—and where are we giving it away?
That is often where the next breakthrough begins.